

2024-07-02
GR5526 GUI专题(4) - Lvgl字体的位图数组合并转换为bin文件的说明


写技术文章

标签

无敌浩克
在第三章节学习如何使用PyVISA、PyLink和openpyxl模块控制频谱仪测量晶体频偏之后,我们已经能够使用更多的模块来搭建我们的测试系统,更为方便快捷的进行自动化测试和数据记录,本章继续拓展更为复杂的CMW仪器控制,并且使用openpyxl里面的chart模块自动化处理RFPHY测试数据,加入loguru模块记录系统测试log。
CMW控制需要使用到的模块为:RsCmwBluetoothSig和RsInstrument
RsCmwBluetoothSig详细信息请参考:
https://pypi.org/project/RsCmwBluetoothSig/
https://rscmwbluetoothsig.readthedocs.io/en/latest/
RsInstrument详细信息请参考:
https://pypi.org/project/RsInstrument/
https://rsinstrument.readthedocs.io/en/latest/
1, 导入相关模块
from RsCmwBluetoothSig import *
from RsInstrument.RsInstrument import RsInstrument
import os
import time
import openpyxl
from openpyxl import Workbook
from openpyxl.chart import (
    LineChart,
    Reference,
    Series,
)
from loguru import logger
2, 创建log file记录系统运行log
################ Create log file################
    if log_record == 1:  # print log info to (log_path)log.txt file
        logger.add('D:\\ test_log_temp\\LE1M_TX_' + file_time + '.log')
        logger.info(f'{file_time} Created by Goodix')
3, 3,创建Excel记录RFPHY测试结果
###################### Create .xls for results recording ################
    test_results = openpyxl.Workbook()
    file_time = time.strftime('%Y-%m-%d-%H_%M_%S', time.localtime(time.time()))
    savefilename = 'LE1M_TX_Test_' + file_time + '.xlsx'
    folder_path = "D:\\ test_results_temp"
    file_path = os.path.join(folder_path, savefilename)
4, 创建BLE RFPHY测试函数
# instrument_rst 配置是否需要复位仪器
# inquiry_enable 配置是否需要仪器自动inquiry DUT,或者是手动连接DUT
# Instrument_address 配置CMW仪器地址
# Test_PVT 配置是否需要测试RFPHY TX power指标
# Test_Modulation 配置是否需要测试RFPHY TX modulation指标
# Test_ACPR 配置师傅需要测试RFPHY ACPR指标
# test_channel_step 配置测试的channel步进
# input_external_att/ output_external_att 配置仪器RF Port衰减
# RF_PORT 配置仪器硬件RF口
# exp_power 配置仪器期望最大输入功率
def BLE1M_TX_Test(instrument_rst=1,
               inquiry_enable=1,
               Instrument_address=0,
               plot_figure=1,
                Test_PVT=1, Test_Modulation=0, Test_ACPR=0,
               test_channel_step=1,
               log_record=0,
                  commport_num=0,
                input_external_att=1.0,
                output_external_att = 1.0,
                RF_PORT = 'RF1COM',
                exp_power=20
               ):
5, RsCmwBluetoothSig模块基本读写功能
#实例化RsCmwBluetoothSig,传入CMW仪器地址信息
driver = RsCmwBluetoothSig(Instrument_address)
driver.utilities.write_st() #往仪器写入指令
driver.utilities.query_str() #从仪器读取信息或者测试结果
详细的指令信息请参考:
《CMW_Bluetooth_UserManual》
《rscmwbluetoothsig-readthedocs》
6, 使用openpyxl.chart模块画出channel-TX power曲线
##########################plot figure##################################
    if plot_figure==1:
        test_results_plot = openpyxl.load_workbook(file_path)
        #设置excel表格的绘图区域
        minRow = 1;  # Include the title
        maxRow = test_channel_len+1;
        minCol = 1;
        maxCol = 4;
        #获取excel文件的所有sheet名字
        sheet_list=test_results_plot.sheetnames
        for sheet in sheet_list:
            if(sheet=='Tx Power avg'):
                sheet_plot = test_results_plot[sheet]
                power_avg=sheet_plot['B2'].value
                # x 坐标的数据,通常用一列数据作为,这里选择第一列
                cats = Reference(worksheet=sheet_plot, min_col=1,min_row=2,max_col=1,max_row=maxRow)
                # 数据收集,选择第2,3,4列作为数据画图
                data = Reference(worksheet=sheet_plot, min_col=minCol+1,min_row=minRow,max_col=2,max_row=maxRow)
                c1 = LineChart()# 折线图
                # from_rows:如果是True表示将一行的数据作为一个条线,如果是False表示按列画
                # titles_from_data:如果是True,表示每一组(根据from_rows确定是每一行还是每一列)数据的第一个作为title
                c1.add_data(data,from_rows=False,titles_from_data=True)
                c1.set_categories(cats)# 设置横坐标
                c1.title = sheet#图表标题
                c1.x_axis.title='Channel'#X轴title
                c1.y_axis.title='Output Power(dBm)'#Y轴title
                c1.y_axis.scaling.min=power_avg-2#Y轴坐标最小值
                c1.y_axis.scaling.max = power_avg+2#Y轴坐标最大值
                c1.y_axis.majorUnit=0.5#Y轴单位主要
                c1.y_axis.minorUnit=0.1#Y轴单位次要
                c1.height=12#图例高度
                c1.width=27#图例宽度

                ## Style the lines+marker
                ##marker Value must be one of {'auto', 'diamond', 'star', 'square', 'triangle', 'dot', 'plus', 'x', 'picture', 'circle', 'dash'}
                s1 = c1.series[0]
                s1.marker.symbol = 'triangle'
                # s2 = c1.series[1]
                # s2.marker.symbol = 'plus'
                # s3 = c1.series[2]
                # s3.marker.symbol = 'star'

                sheet_plot.add_chart(c1, 'F2')#将图标加到sheet中,可以指定图的位置
                test_results_plot.save(file_path)
实测仅需10秒钟就可以测试0-39全channel的TX功率特性,自动记录在excel里面并画图,这测试效率用起来是不是嘎嘎香呢😎
测试GR533x SK板的HPA运行的结果如下: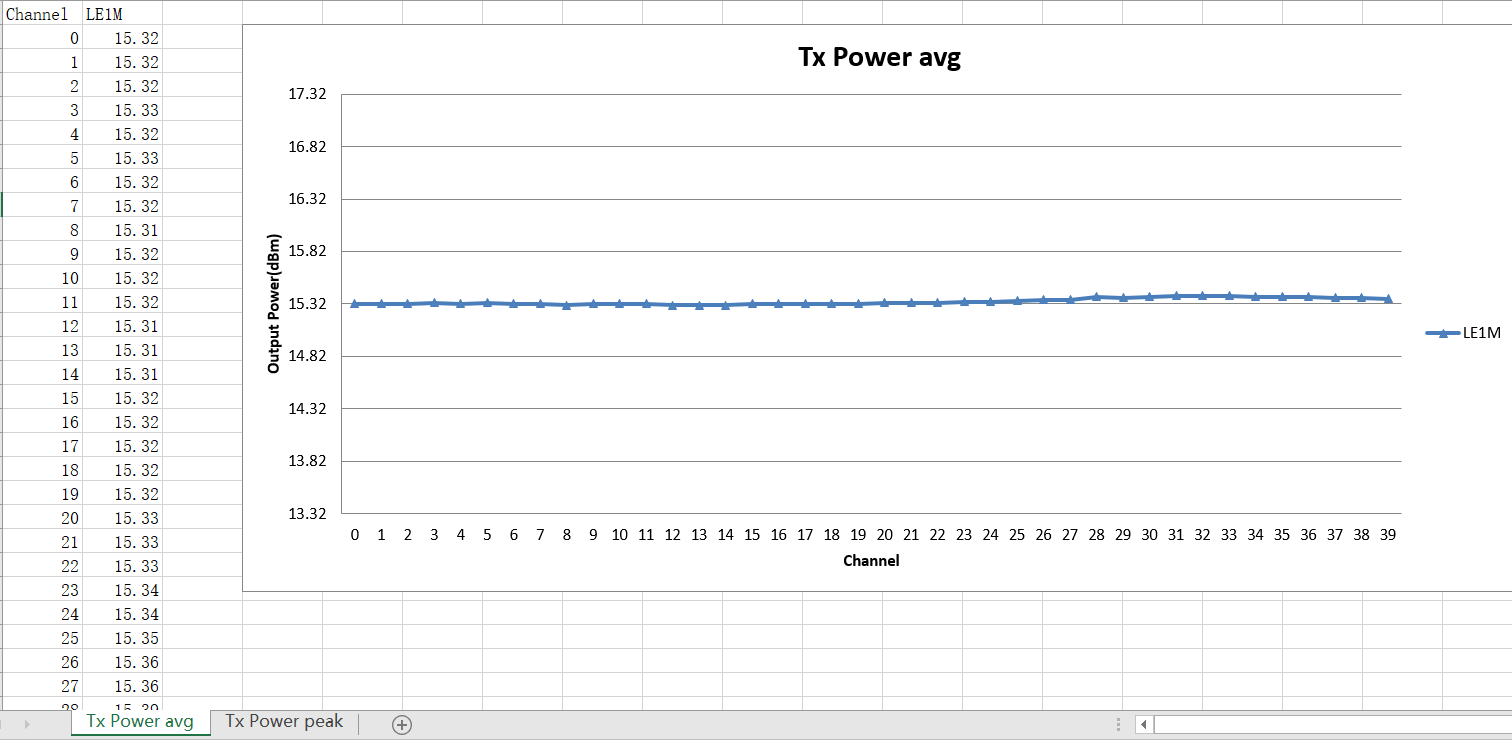
完整的BLE1M TX测试参考code请在评论区查看,CMW Bluetooth测试指令请在评论区查看。

打开微信,使用“扫一扫”即可关注